Agent evaluation: Cut the 80% time waste
Teams burn 60% to 80% of their engineering cycles on evaluation and error analysis, according to Datadog research. The Datadog MCP Server and Pup CLI stop this bleed by converting raw telemetry into executable debugging commands inside your existing development environment.
Agent Observability gives engineers structured access to production data, tracing every prompt and response without context switching. We are moving past simple inline suggestions to architectures where Pup CLI exposes Datadog's API surface directly to coding agents. This enables native tool calls for searching traces and walking span trees. These capabilities form the backbone of new Agent Skills that package complex engineering tasks into single, executable commands.
Operationalizing these tools turns session classification and error resolution into a repeatable workflow. You can transform production LLM traces into evaluation datasets and visualize experiment results directly in a Datadog Notebook. This approach breaks the cycle of rebuilding evaluation sets every time the technology stack shifts, solving the core inefficiency dragging down modern AI engineering teams.
The Role of Agent Observability in Modern AI Engineering
Defining Agent Observability Through Prompt and Response Tracing
Granular telemetry for every prompt and response is the only way to resolve autonomous system failures. Traditional monitoring tracks infrastructure health, but it is blind to the specific complexity of multi-step reasoning where standard uptime metrics fail to detect logical errors. Coding agents like Claude Code, Cursor, and Codex CLI handle implementation tasks effectively, yet post-deployment analysis remains a severe bottleneck. Teams reportedly spend 60% to 80% of their time on evaluation and error analysis, repeating efforts whenever technology stacks shift.
Datadog Agent Observability closes this gap by tracing every interaction and running online evaluations over the collected data. This moves beyond basic completion tracking to provide full traceability across local IDEs and cloud sandboxes. The market has diversified into architectures requiring agnostic data capture across disparate deployment models. Operators cannot validate agent reliability or cost-efficiency against real production behavior without capturing intermediate reasoning steps and tool invocations.
Accessing this telemetry often forces engineers to leave their coding environment to query separate dashboards. Integrating trace data directly into the agent's toolset allows for immediate classification of sessions and root cause analysis without manual query construction. Builders gain the ability to turn production traces into evaluation datasets directly within their existing workflows.
| Feature | Traditional Monitoring | Agent Observability |
|---|---|---|
| Primary Target | Infrastructure uptime | Reasoning logic and tool use |
| Data Scope | Metrics and logs | Prompt/Response spans and evals |
| Failure Mode | Service outage | Logical hallucination or loop |
The inability to correlate user feedback with specific reasoning paths leaves significant blind spots in quality assurance.
Applying the Datadog MCP Server Toolset to Local and Cloud Agents
The Datadog MCP Server exposes production telemetry directly within coding agents to bridge local development and cloud execution.
Agents operate across distinct environments, technically segmented into local IDE attachments, CLI-native interfaces, and cloud-hosted sandboxes. This architectural diversity requires monitoring solutions that capture data regardless of where the agent executes. The Agent Observability toolset provides structured access to this distributed trace data, allowing developers to query production failures without leaving their editor. The Datadog MCP Server enables native tool calls for searching traces, walking span trees, pulling experiment summaries, and writing findings into a Datadog Notebook. CLI-native workflows apply the Pup CLI to pipe error logs directly into debugging sessions, returning trace IDs without leaving the terminal.
| Deployment Model | Tooling Interface | Primary Advantage |
|---|---|---|
| Local IDE | Native Extension | Context-aware suggestions |
| CLI Native | Shell Commands | Scriptable automation |
| Cloud Sandbox | API Integration | Isolated execution safety |
Operationalizing this flow means every production incident can instantly seed a new evaluation case. AI app observability transforms raw traces into structured learning opportunities, reducing the manual effort required to maintain high-quality eval sets.
Risks of Repeating Error Analysis Across Shifting Technology Stacks
LLM trace analysis defines the systematic inspection of prompt-response chains to isolate reasoning failures in autonomous agents. Evaluation practices have matured from theoretical demos to rigorous workflows involving curated datasets, yet significant inefficiency persists. Much of the work on evaluation requires repetition whenever the underlying technology stack shifts, forcing teams to reconstruct error baselines constantly. This volatility creates a specific risk where engineering effort divides between fixing bugs and re-validating the tools used to find them.
Agents are technically segmented into local IDE-attached environments, CLI-native interfaces, and cloud-hosted sandboxes, complicating consistent data collection. Complex queries are often not well represented in existing offline evaluations, so teams may lack signals that anything is wrong until production issues arise. The limitation is clear: without persistent telemetry, every infrastructure change resets the learning curve for failure modes. Builders must prioritize observation layers that decouple trace analysis from the specific agent runtime to avoid this cyclical waste.
Architecture of Integrated Debugging with MCP and Pup CLI
Datadog MCP Server Toolsets and Pup CLI Command Structure
The Datadog MCP Server exposes two distinct toolsets for agent interaction. The llmobs toolset handles trace retrieval and experiment access, while the core toolset manages cross-product utilities like Datadog Notebook exports. This separation allows coding agents to request only the permissions required for specific debugging tasks. Shell-based workflows rely on Pup CLI to access the same API surface. A command like pup llmobs traces search --ml-app task-cruncher --has-error returns trace IDs directly to the terminal. This approach suits CI pipelines where piping output matters more than interactive reasoning.
| Feature | Datadog MCP Server | Pup CLI |
|---|---|---|
| Primary Interface | Native tool calls | Shell commands |
| Best For | Interactive reasoning | Scripting and CI runs |
| Data Access | llmobs and core toolsets | Full API surface via flags |
| Integration Mode | Client-embedded skills | Pipe-based workflows |
Teams must choose between embedding logic in the client or orchestrating via shell scripts. The MCP Server enables agents to reason about data alongside code generation, whereas Pup CLI excels at linear execution paths. Installing skills requires cloning the agent-skills repository and copying specific directories to the local skills path. Production telemetry remains accessible regardless of the chosen orchestration method. Teams piping shell output into interactive IDE sessions should also account for latency compared to direct tool invocation.
Installing MCP Server in Claude Code and Configuring Pup Auth
Integration begins by executing claude mcp add --scope user --transport http "datadog-llmo-mcp" "mcp.datadoghq.com/api/unstable/mcp-server/mcp?toolsets=llmobs,core" to register the remote procedure call endpoint. This single command configures Claude Code to access both the llmobs and core toolsets, enabling the agent to retrieve trace data and export findings directly into a Datadog Notebook. The mechanism relies on HTTP transport, allowing the coding agent to invoke structured tools rather than parsing unstructured text outputs. Authentication credentials may expire, necessitating a manual refresh via pup auth refresh upon receiving a 401 error.
Builders must choose between native tool calling and shell-based invocation based on their workflow requirements.
The Pup CLI installation requires running go install github.com/datadog-labs/pup@latest followed by adding the binary to the system path. Once authenticated, operators can integrate agent skills with a coding agent by piping command outputs, such as searching for errors without leaving the terminal environment. The constraint here involves balancing the rich context available to MCP-enabled agents against the lightweight, pipe-friendly nature of CLI tools for automated scripts.
Operationalizing Trace Analysis for Session Classification and Error Resolution
Defining Weak Labeling for AI Session Classification
Silence dominates production logs. In environments like the Task Cruncher example, only a few percent of customers provide direct thumbs-up or thumbs-down feedback, leaving most sessions unverified. This scarcity prevents accurate model tuning without intervention. The agent-observability-session-classify skill generates binary labels when explicit user ratings are absent. It applies weak labeling techniques to infer session quality from available telemetry. The system synthesizes a verdict by correlating the trace itself, Real User Monitoring (RUM), and Audit records. Human input is not required for this initial classification.
Latency spikes or error logs in the audit history act as negative signals. The system assigns a provisional thumbs-down to troubled sessions based on these markers. Clean traces paired with stable RUM scores receive a positive classification. Automation keeps evaluation datasets statistically significant despite low user engagement rates. Builders run continuous regression tests on real traffic patterns rather than stale, synthetic prompts. Weak labels serve as probabilistic indicators rather than ground truth. Periodic validation against the rare instances of explicit human feedback maintains calibration accuracy.
Debugging Task Cruncher's Complex Query Failures with Trace RCA
Multi-project coordination questions dominate recent Task Cruncher user submissions. Current offline evaluations miss these entirely. The agent-observability-trace-rca skill accepts production traces alongside user feedback to execute automated root cause analysis. Simple error logging fails here. This tool ingests context from the codebase to suggest specific fixes for complex query failures. When run with the codebase in context, the skill analyzes traces to identify where the agent struggled with complex queries. Raw telemetry becomes a structured Datadog Notebook. Engineering teams review findings without manual data aggregation.
Initial feedback signals dictate the quality of the output. If explicit user ratings remain sparse, the skill relies heavily on inferred error states. Teams must verify that their existing Audit Trail captures sufficient detail to distinguish between a misunderstood intent and a genuine system failure. Automated analysis might flag valid but complex reasoning paths as errors without this granularity.
Exporting these findings enables a direct path from production anomaly to code fix. Engineers share the generated notebook to validate whether a proposed patch resolves the specific coordination logic gap. Manual correlation of logs with user complaints consumes less time. Production behavior directly informs the next iteration of agent capabilities within this closed-loop system.
Bootstrapping Evaluators from Production Traces
Live error traces replace static datasets when engineers initiate the agent-observability-eval-bootstrap skill. This workflow targets gaps where existing offline evaluations fail to capture complex, multi-project coordination queries. The process requires selecting representative failure spans and defining success criteria based on actual user intent. Teams choose an output format compatible with their testing infrastructure, such as a JSON struct or Python SDK definition.
Bootstrapped logic may overfit to specific noise patterns present in the initial trace window, so evaluation datasets must evolve alongside application behavior.
Bootstrapping Evaluation Datasets and Running Experiment Analysis
The Six-Phase Eval Pipeline for Trace-to-Experiment Conversion
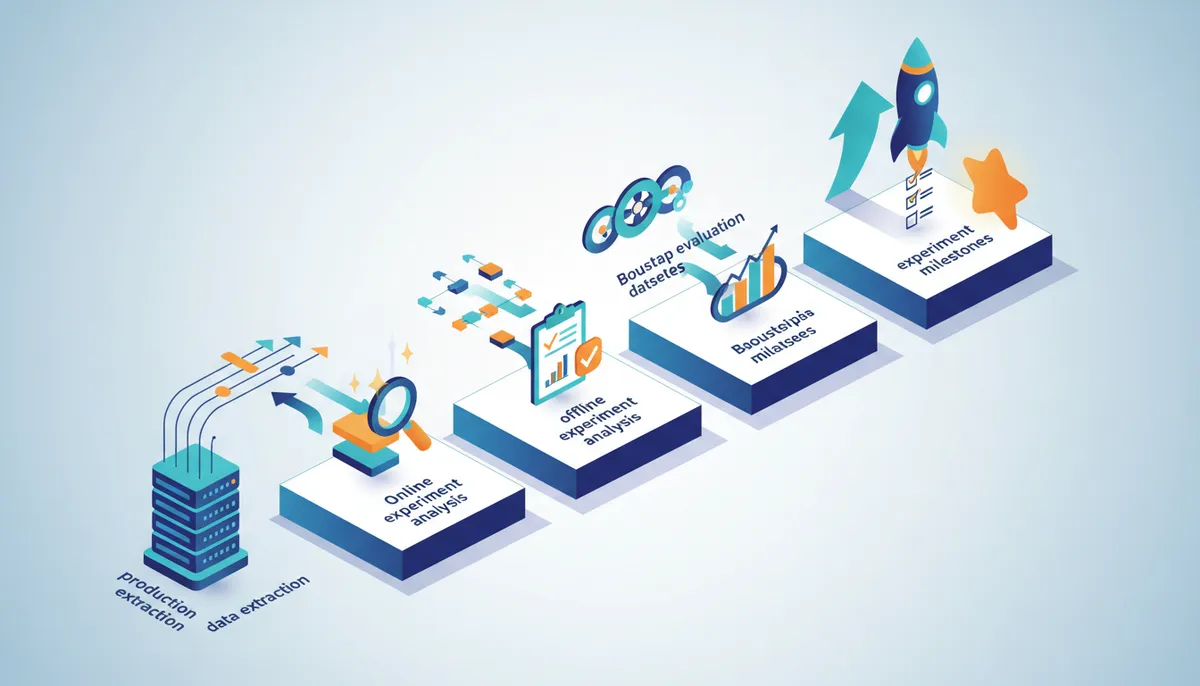
The agent-observability-eval-pipeline skill moves users from raw traces to a functioning experiment setup without manual busywork. Automation handles the heavy lifting that usually consumes engineering hours. Classification of ml_app traces starts the process, followed immediately by Root cause analysis to isolate failure modes before the system generates evaluators from production data.
- Classify ml_app traces to tag sessions with weak labels.
- Execute Root cause analysis on flagged spans.
- Bootstrap evaluators using derived heuristics.
- Create and publish the evaluation dataset.
- Generate and run the offline experiment.
- Analyze experiment results within a Notebook.
Structured steps keep the agent context window clean. Unfiltered trace data often overwhelms smaller models, so this sequence filters noise first.
Isolating Bootstrap evaluators from raw ingestion ensures test sets contain only the failure patterns. Engineers run quality checks against a stable dataset instead of shifting production traffic blindly. The final phase exports metrics directly to a Notebook. Side-by-side comparison of agent versions becomes possible before any deployment occurs.
Executing Offline Experiments with Python Bootstrap and Analyzer Skills
Running the agent-observability-experiment-py-bootstrap skill automates environment setup and dataset creation. This Python-only tool builds placeholder experiment tasks and evaluator configurations without manual scripting. Specific gaps vanish, such as the multi-project queries that slowed the Task Cruncher team. Developers then invoke the agent-observability-experiment-analyzer to select specific metrics like answer_quality_judge for deep inspection. A report emerges containing key findings, potential follow-ups, and supporting telemetry data ready for Notebook export.
- Execute the bootstrap skill to initialize the evaluation environment.
- Select target metrics such as answer quality or safety constraints.
- Export the generated analysis report directly to a Notebook.
Evaluation shifts from ad-hoc scripting to reproducible pipeline execution. Rapid iteration conflicts with rigorous validation sometimes. Automated bootstrapping speeds up the cycle but demands careful metric selection to avoid validating against noisy production data. Manual setups require extensive prompt engineering, whereas this approach uses existing trace metadata to seed evaluators. Weak labels from production traffic mean the resulting dataset may inherit biases present in the live system. Teams must verify that bootstrapped evaluators align with domain-specific success criteria before trusting experiment outcomes. Exporting to a Notebook enables collaborative review so domain experts can annotate findings before promoting changes to production.
Validation Checkpoints for Evaluator Bootstrapping and Dataset Publishing
Transitioning from root cause analysis requires confirming that derived heuristics accurately reflect production failure modes before publishing datasets. The agent-observability-trace-rca skill accepts traces and user feedback to run error analysis across a given time range and can suggest specific fixes if run with the codebase in context.
| Phase | Confirmation Requirement | Action Trigger |
|---|---|---|
| Bootstrap evaluators | Verify heuristic alignment with trace errors | Approve evaluator logic |
| Create + publish dataset | Validate sample diversity and size | Commit dataset version |
- Review the generated evaluator logic against specific Root cause analysis findings.
- Confirm the dataset includes edge cases identified during the Classify ml_app traces stage.
- Execute the publish command only after manual verification of the checkpoint banner.
Premature publishing locks flawed assumptions into the experiment configuration. Subsequent regression detection becomes unreliable once bad data enters the system. The agent-observability-experiment-analyzer cannot correct upstream labeling errors once the dataset is committed. Treat the checkpoint confirmation as a hard boundary between exploratory analysis and the experiment definition. This discipline ensures that Bootstrap evaluators measure actual service degradation rather than artifacts of the labeling process.
About
Priya Nair, AI Industry Editor at AI Agents News, brings rigorous market analysis to the complex challenge of production LLM traces. As the lead covering product launches and platform shifts for tools like Claude Code and Cursor, she daily tracks how engineering teams struggle with the post-coding reality: debugging opaque agent behaviors. This article connects her deep monitoring of the coding agent system to practical solutions for observability. By synthesizing trends from substantial vendors and independent builders, Nair explains why capturing telemetry for every prompt and response is no longer optional. Her work at AI Agents News ensures that technical founders and engineers receive verified, actionable insights on managing agentic workflows, moving beyond hype to address the concrete reliability issues facing production AI applications today.
Conclusion
The bottleneck was never generating traces. It is turning them into something a team can act on, and that is what the Datadog MCP Server and Pup CLI change: traces stay reachable from the environment where the code is written, sessions get classified without waiting for explicit ratings, and a failing production query becomes an evaluation case instead of a ticket.
The discipline that keeps this honest is narrow. Check that derived heuristics match the failure modes visible in recent traffic, treat the checkpoint confirmation as the boundary between exploratory analysis and a committed experiment, and export results to a Notebook so review is shared rather than private. Hold that line and the 60% to 80% of engineering time now spent re-running error analysis stops resetting with every stack change.
Frequently Asked Questions
Teams reportedly waste 60% to 80% of their time on these repetitive tasks. This massive drain forces engineers to constantly redo work whenever their technology stack shifts or updates.
It identifies logical hallucinations and reasoning loops that traditional uptime metrics cannot see. Standard monitoring often fails to detect these multi-step reasoning errors within autonomous systems.
The Pup CLI allows users to return trace IDs directly from the shell. A single command searches for errors without requiring developers to leave their current terminal session.
They use weak labeling to derive binary signals from existing telemetry like audit trails. This method converts silent failures into actionable data even when only a few percent of customers provide feedback.
Users can view experiment results directly within a Datadog Notebook for immediate analysis. This integration eliminates the need to rebuild evaluation sets whenever the underlying technology stack changes.
References